Relative Elevation Model
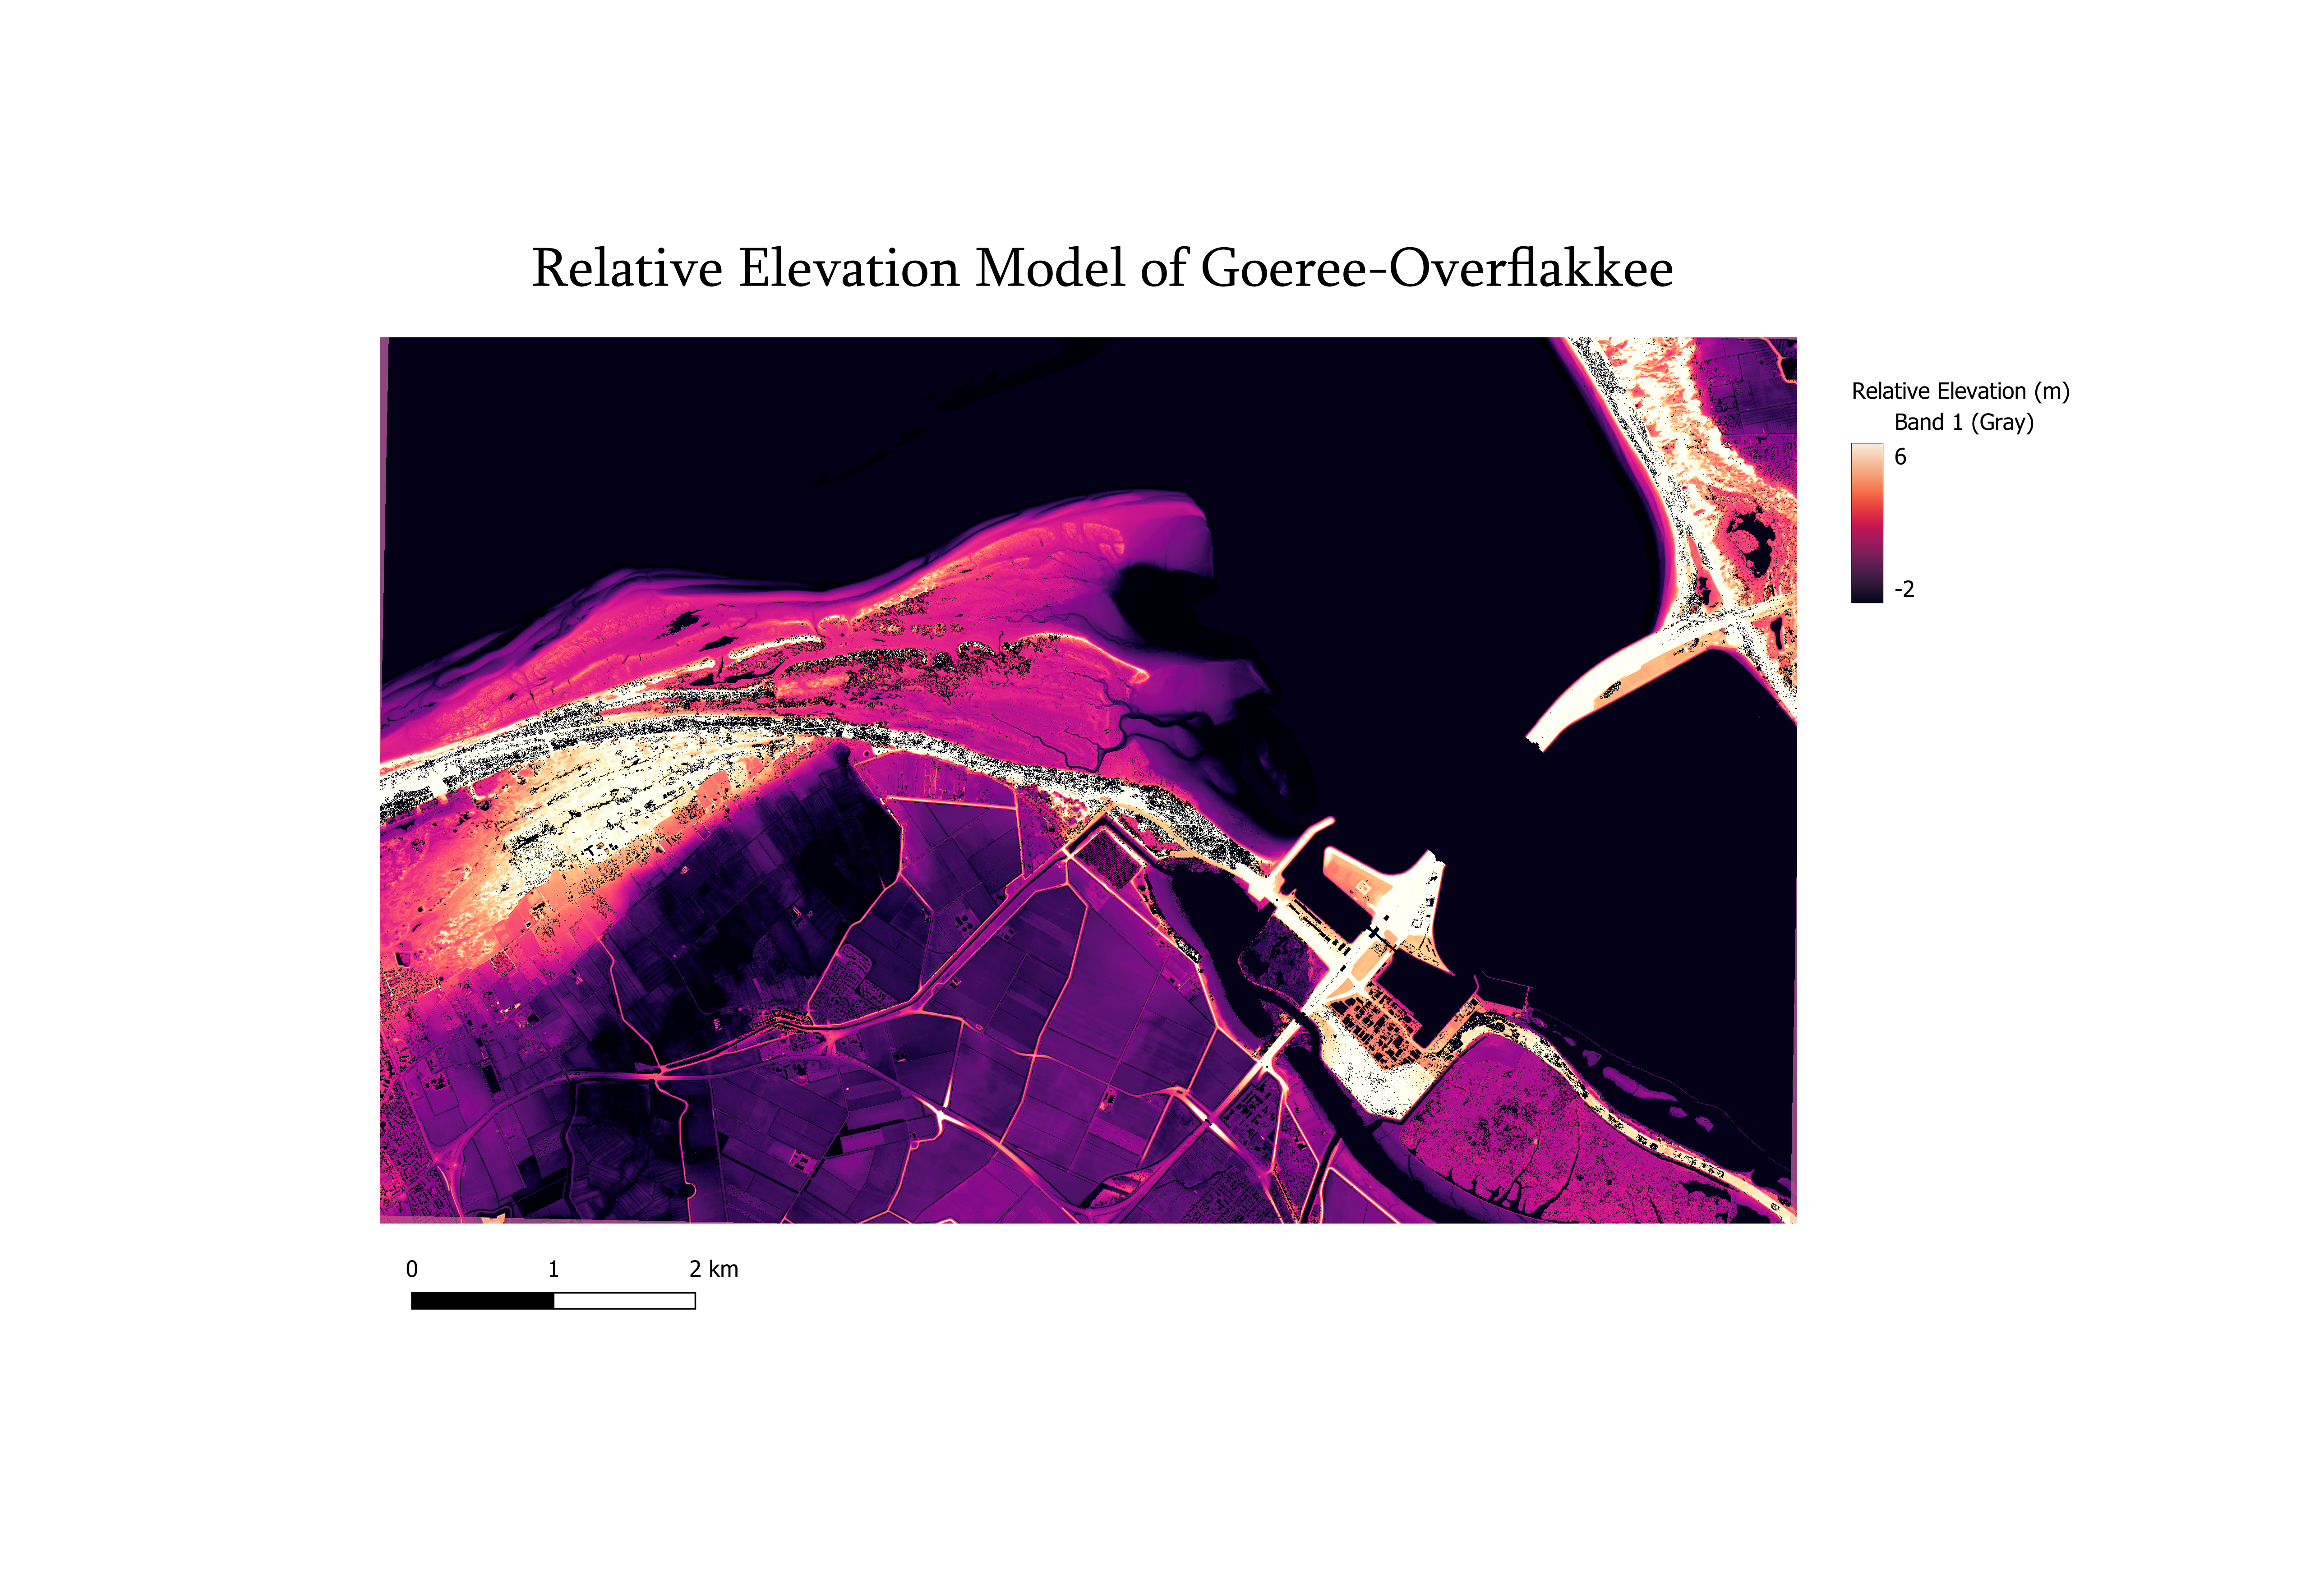
I made a Relative Elevation Model on QGIS. These are derived from a Digital Terrain Model that was derived from LiDAR data. A relative elevation model represents the height of a terrain relative to a specific reference point or surface, highlighting variations in elevation across a landscape.
The map covers the Goeree-Overflakkee, a delta province in the southern part of the Netherlands, is known for having the largest beach in the country and is a popular destination for beach resort tourism. It could be quite interesting to observe the natural changes in elevation and compare them to man-made ground structures.
How was it made?
- I downloaded the data from the online Geotiles resource in a zip file (two resources). I opened the tiles and merged the two files into one tiff file.
- I changed the symbology of the layer to clearly show the elevations of the map.
- I added a cross section layer, where I drew lines perpendicular to the river and added elevations for all these cross section lines, with the elevations going from high to low to show the downstream flow of the river.
- I interpolated this layer using the TIN interpolation and calculated a new raster layer, in which I subtracted the interpolated layer from the original tiff layer with the two geotiles.
- I changed the symbology to make the map's elements stand out best, and printed and stylized the map.
Skills Acquired
I learned how to employ raster calculations and TIN interpolation. Through the stylistic choices, I practiced the art of cartography.